When UST-Curve Flattens Again
What’s Behind the Latest Move in U.S. Treasuries

Based on a specific question that has been asked frequently on Bloomberg TV to invited guests over the past few days, I have observed that something interesting is happening across the US Treasury (UST) market.
After spending much of the past year in an inverted configuration — with short-term yields higher than long-term ones — the curve has begun to flatten again, but this time from the long end.
The decline in 10y and 30y yields relative to the mid-curve is no coincidence; it tells a subtle story about where we are in the interest-rate cycle.
From Inversion to Steepening — and Back Again
Earlier this year, the yield curve was deeply inverted as the Fed held policy rates at restrictive levels. Cash and short-term bills yielded more than long bonds, and investors were rewarded for staying short.
As inflation started to cool and markets began to price eventual rate cuts, the curve steepened: longer maturities offered meaningfully higher yields — more than one percentage point above short-term rates in some cases.
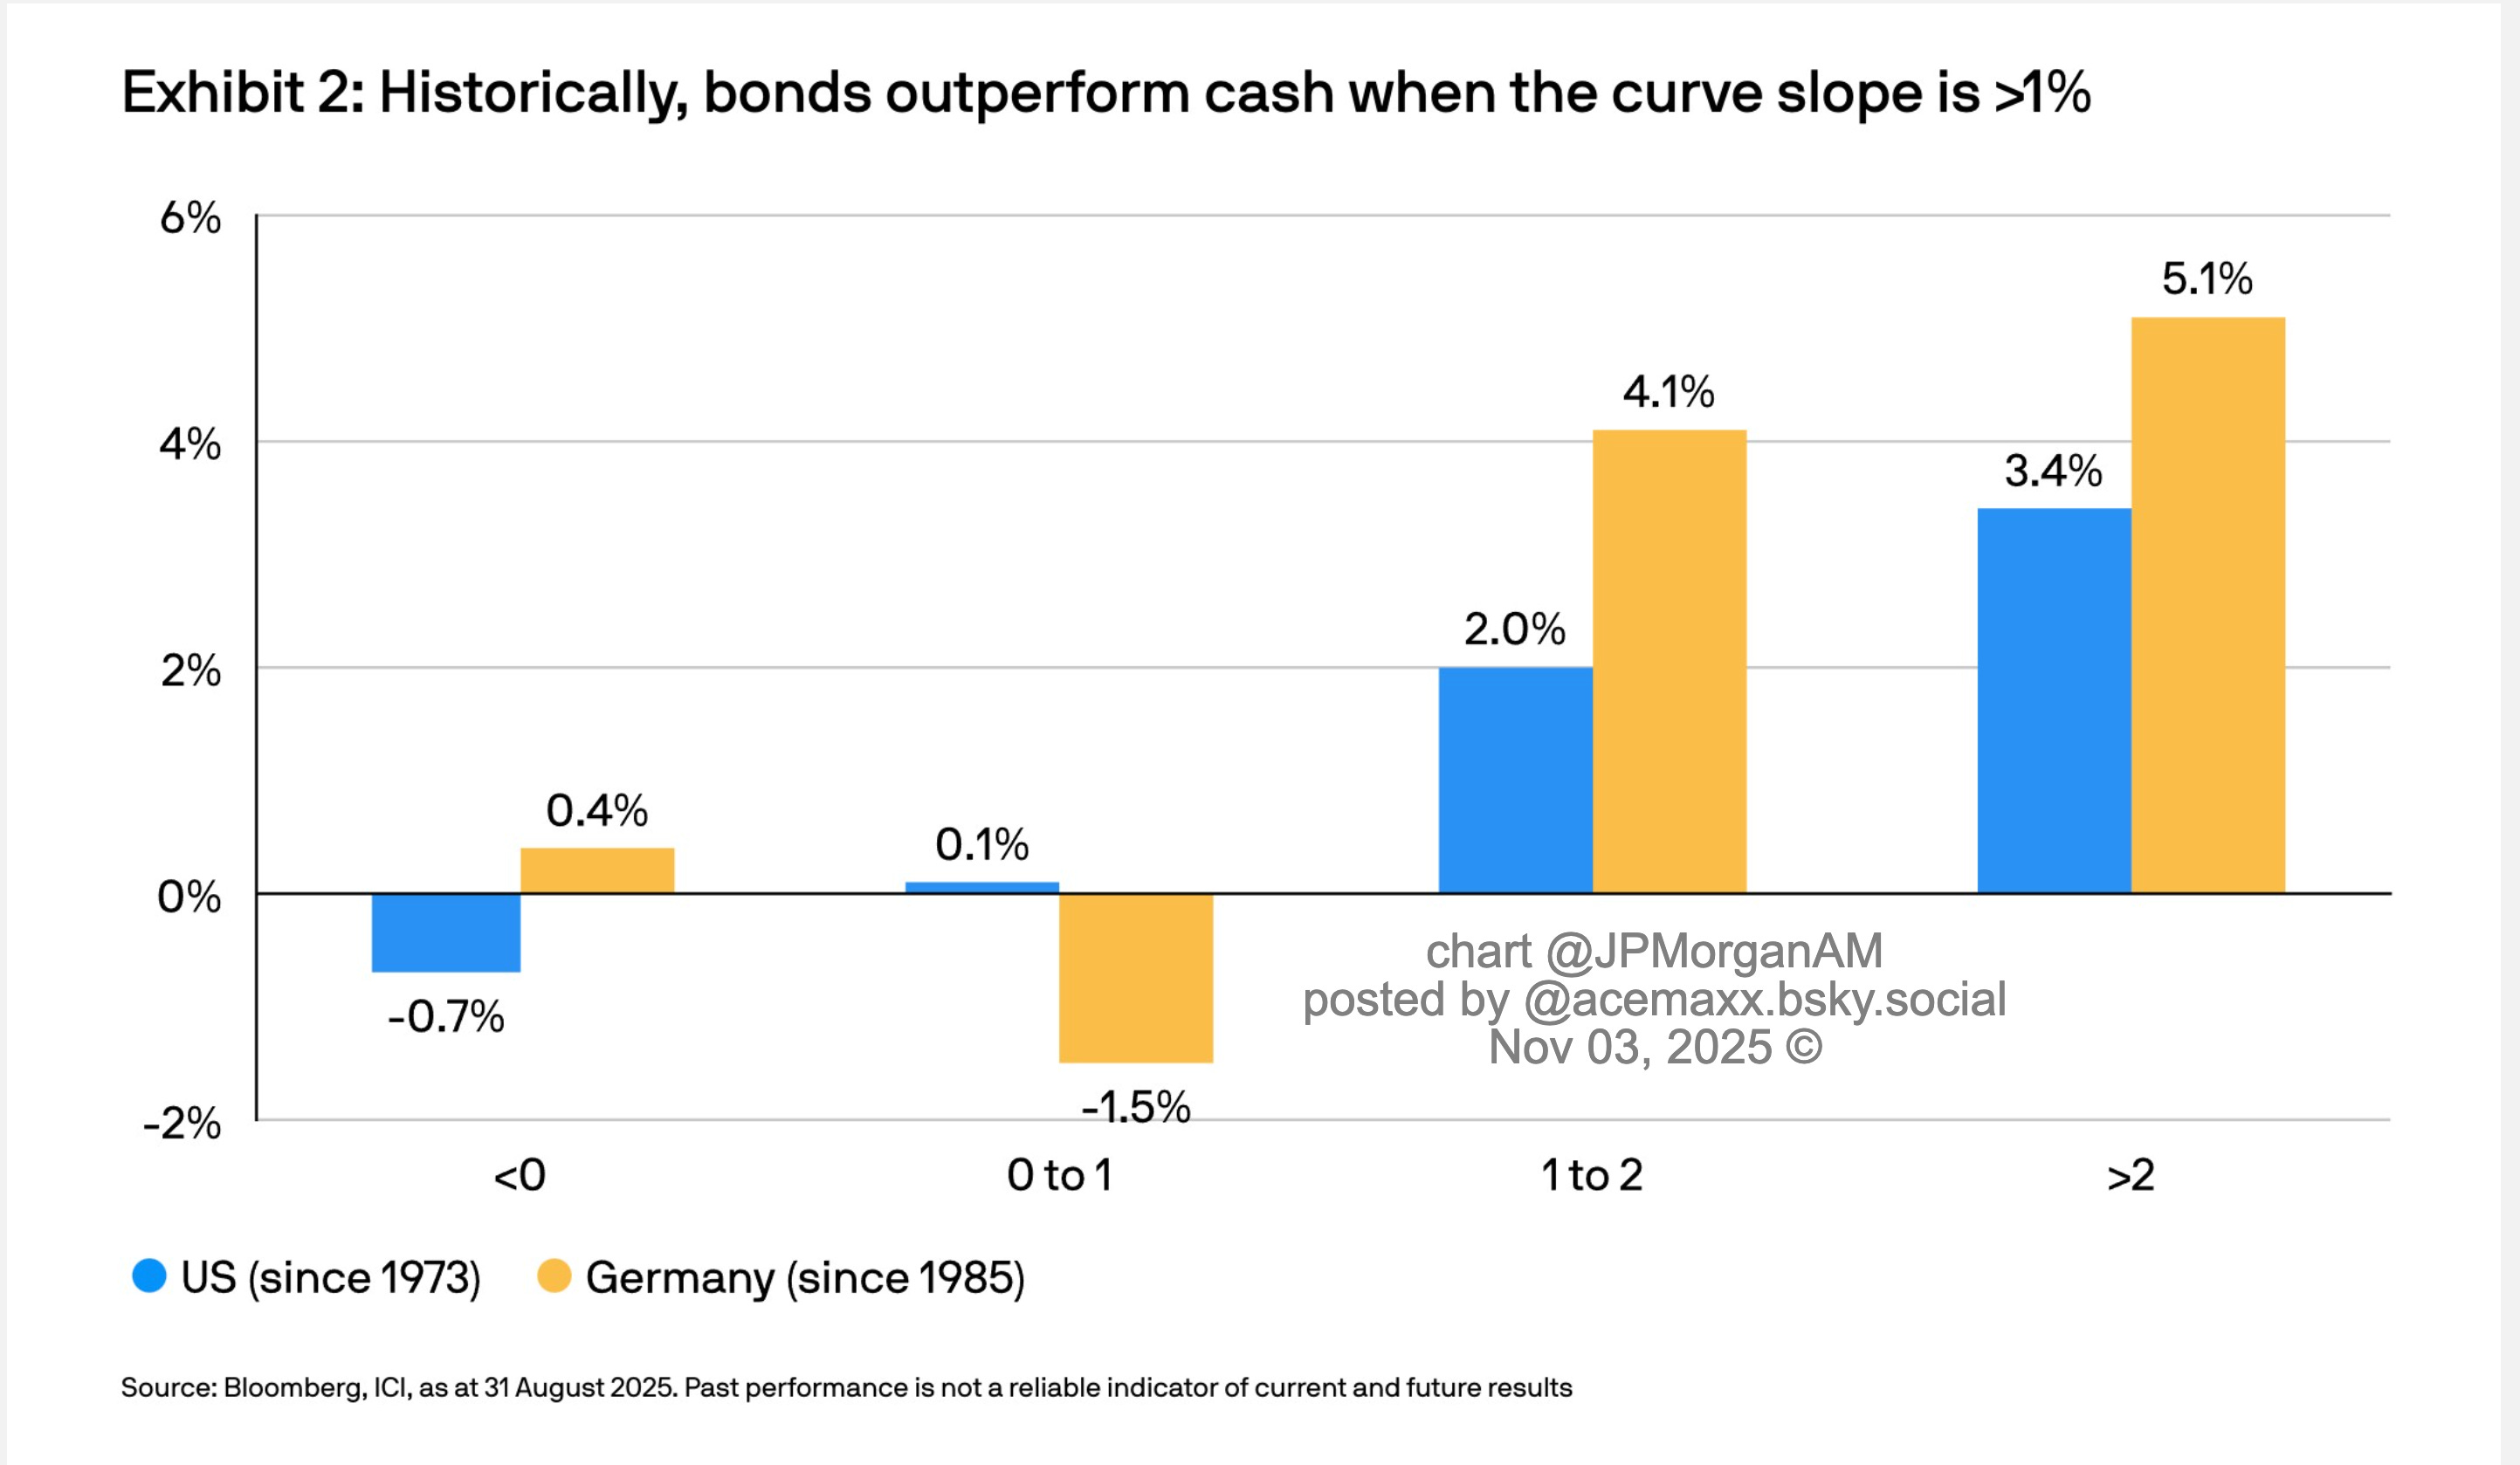
As JPMorgan Asset Management recently noted, historically, bonds tend to outperform cash when the curve slope exceeds 1%.
Why? Because a steep curve compensates investors for taking duration risk — you lock in higher yields today, and if short-term rates eventually fall, you earn both the coupon (“carry”) and a capital gain (“roll-down”) as your bond’s yield moves down the curve.
Why Long Yields Are Falling Now
That same logic has now triggered a reversal.
With inflation moderating and economic data suggesting a soft landing, investors have rushed to capture those higher long yields before they vanish.
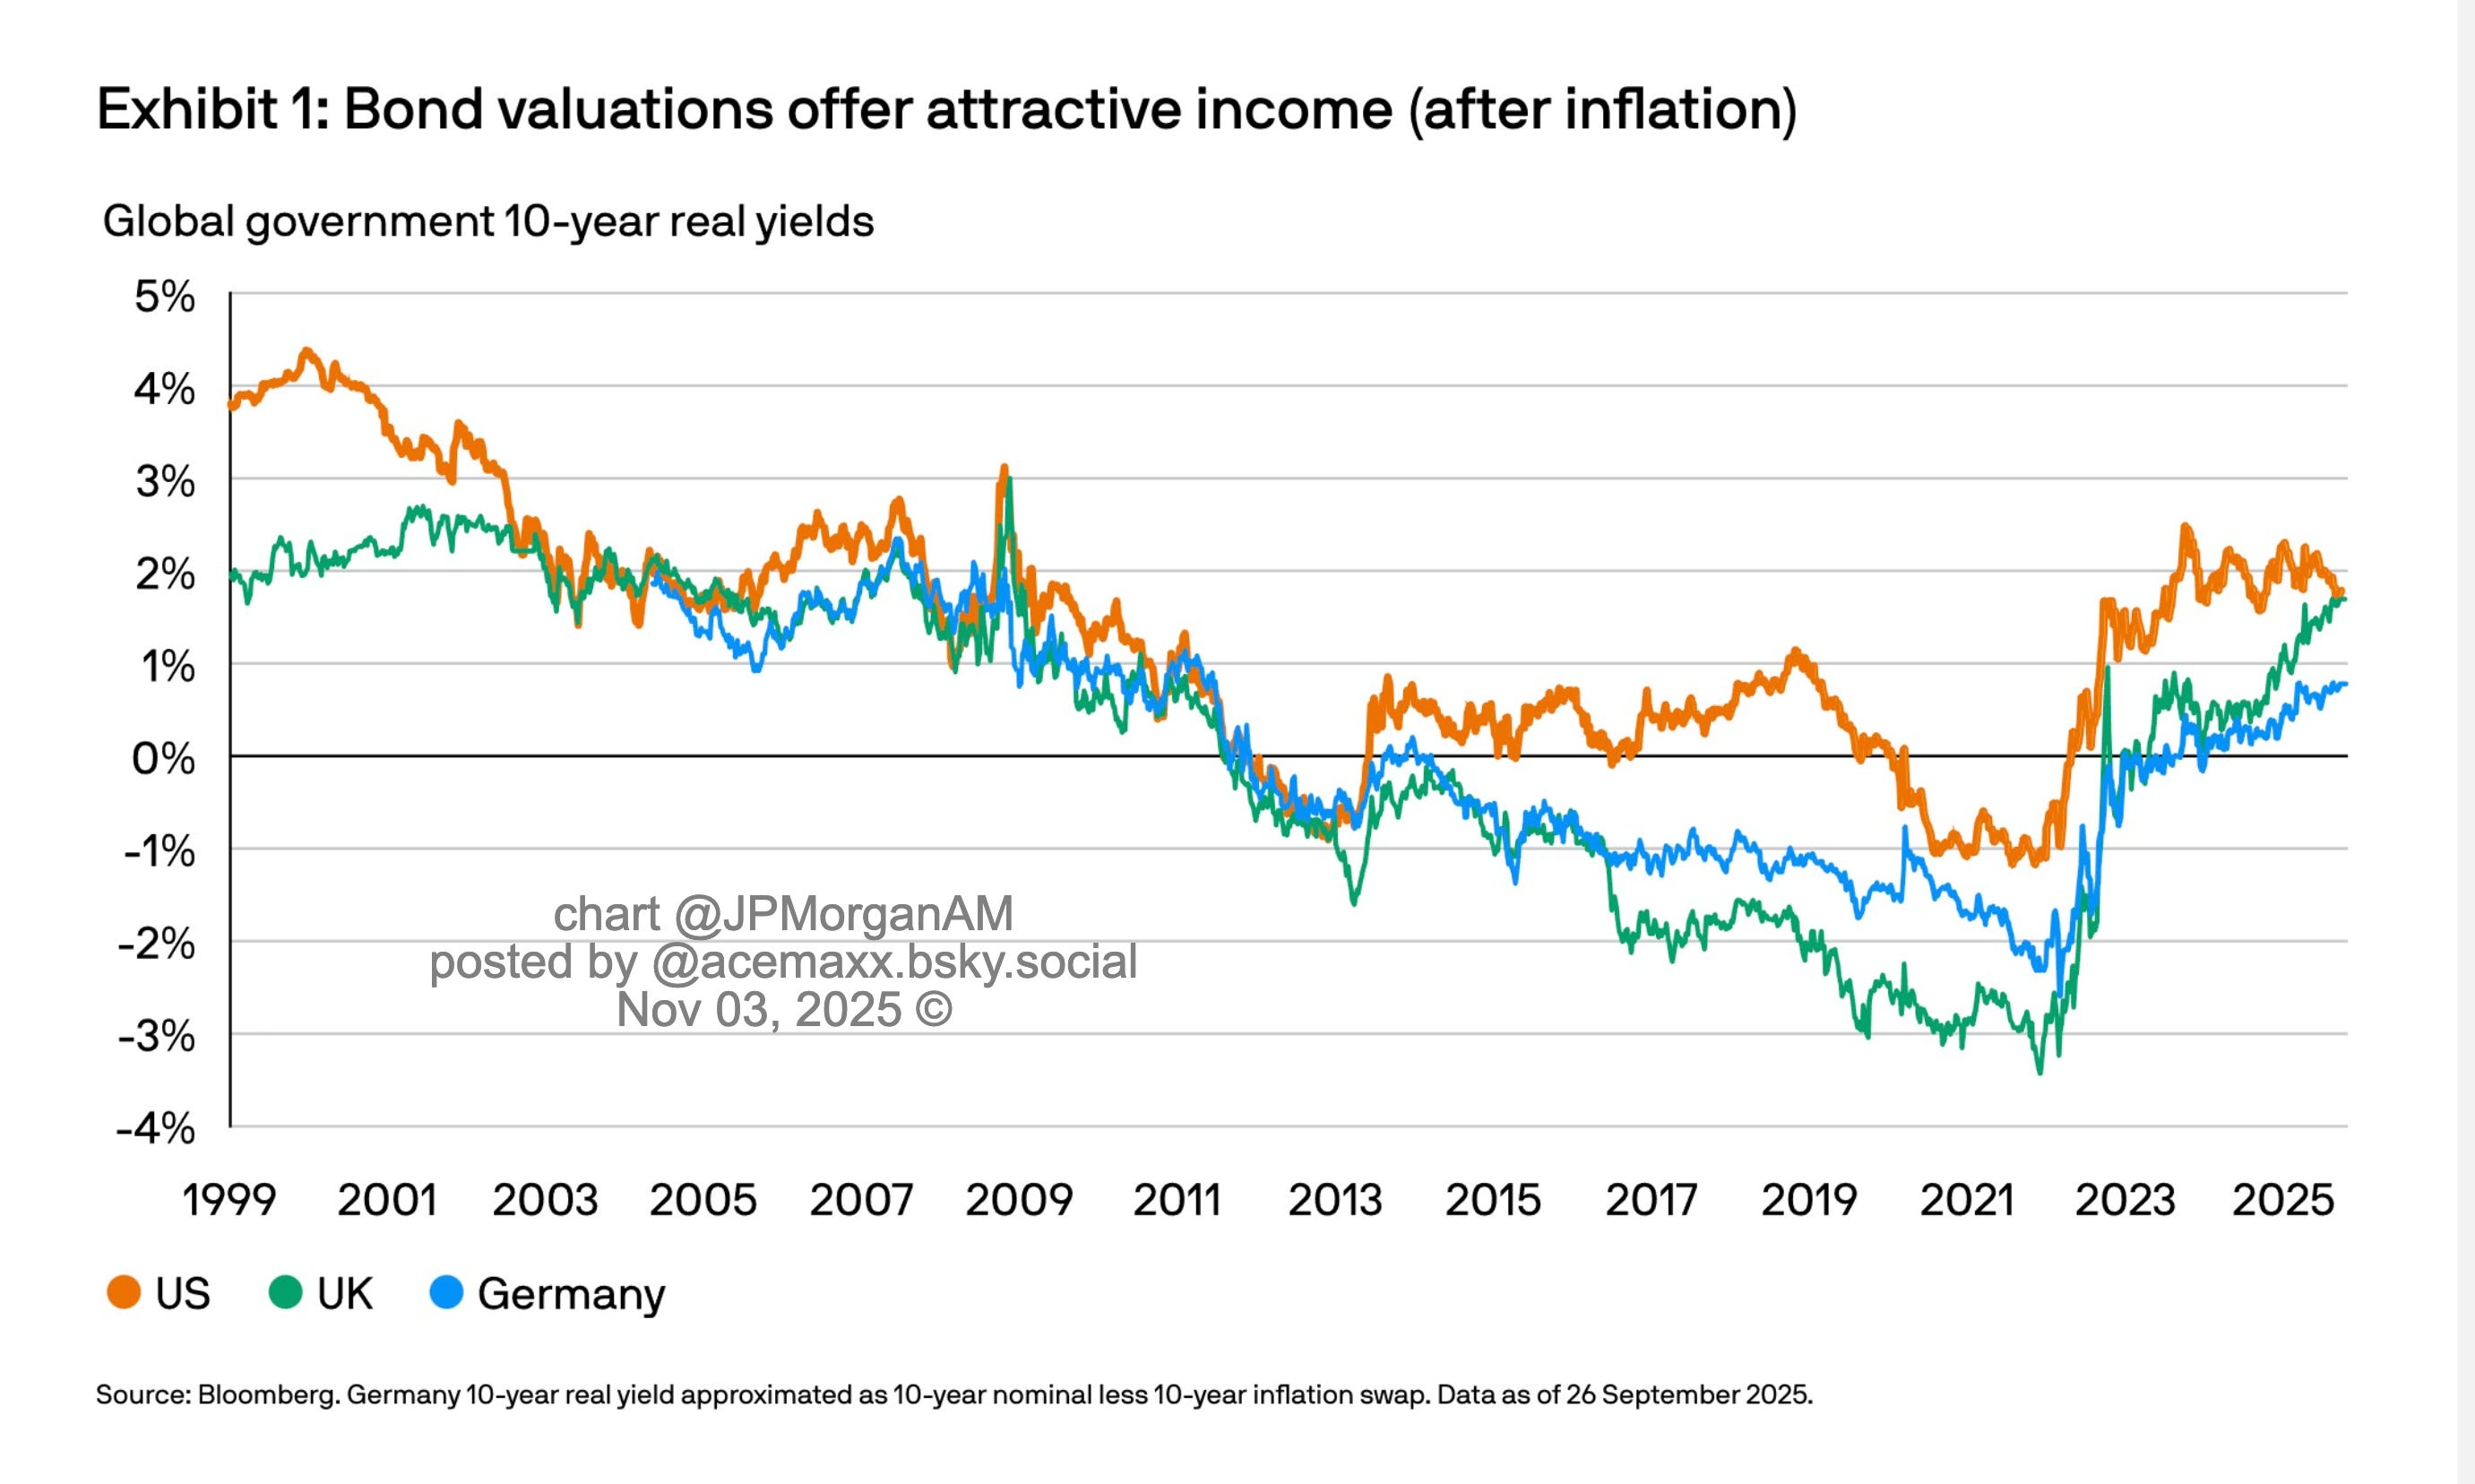
In addition, real yields on long Treasuries — around 2% or more — look attractive to pension funds, insurance companies, and global reserve managers seeking duration.
The result:
strong demand for long maturities, and therefore a bull flattening of the curve — yields declining more at the long end than at the short end.
Term Premiums and Position Unwinds
Part of this move also reflects a lower term premium, the extra compensation investors require for holding long-term bonds.
During the inflation scare of 2023–24, term premiums rose sharply. Now, as inflation fears recede and policy credibility returns, that premium is compressing again.
At the same time, many macro hedge funds that had been short duration are closing those positions, accelerating the rally in long bonds.
Reading the Curve: What It’s Telling Us
This bull flattening phase typically marks the late stage of the tightening cycle.
The curve had steepened when investors first anticipated easier policy; now that the easing narrative is priced in, long yields decline as the market looks ahead to slower growth and lower inflation.
In other words, the curve is not merely a technical construct — it’s a dynamic reflection of expectations about monetary policy, inflation, and term premiums.
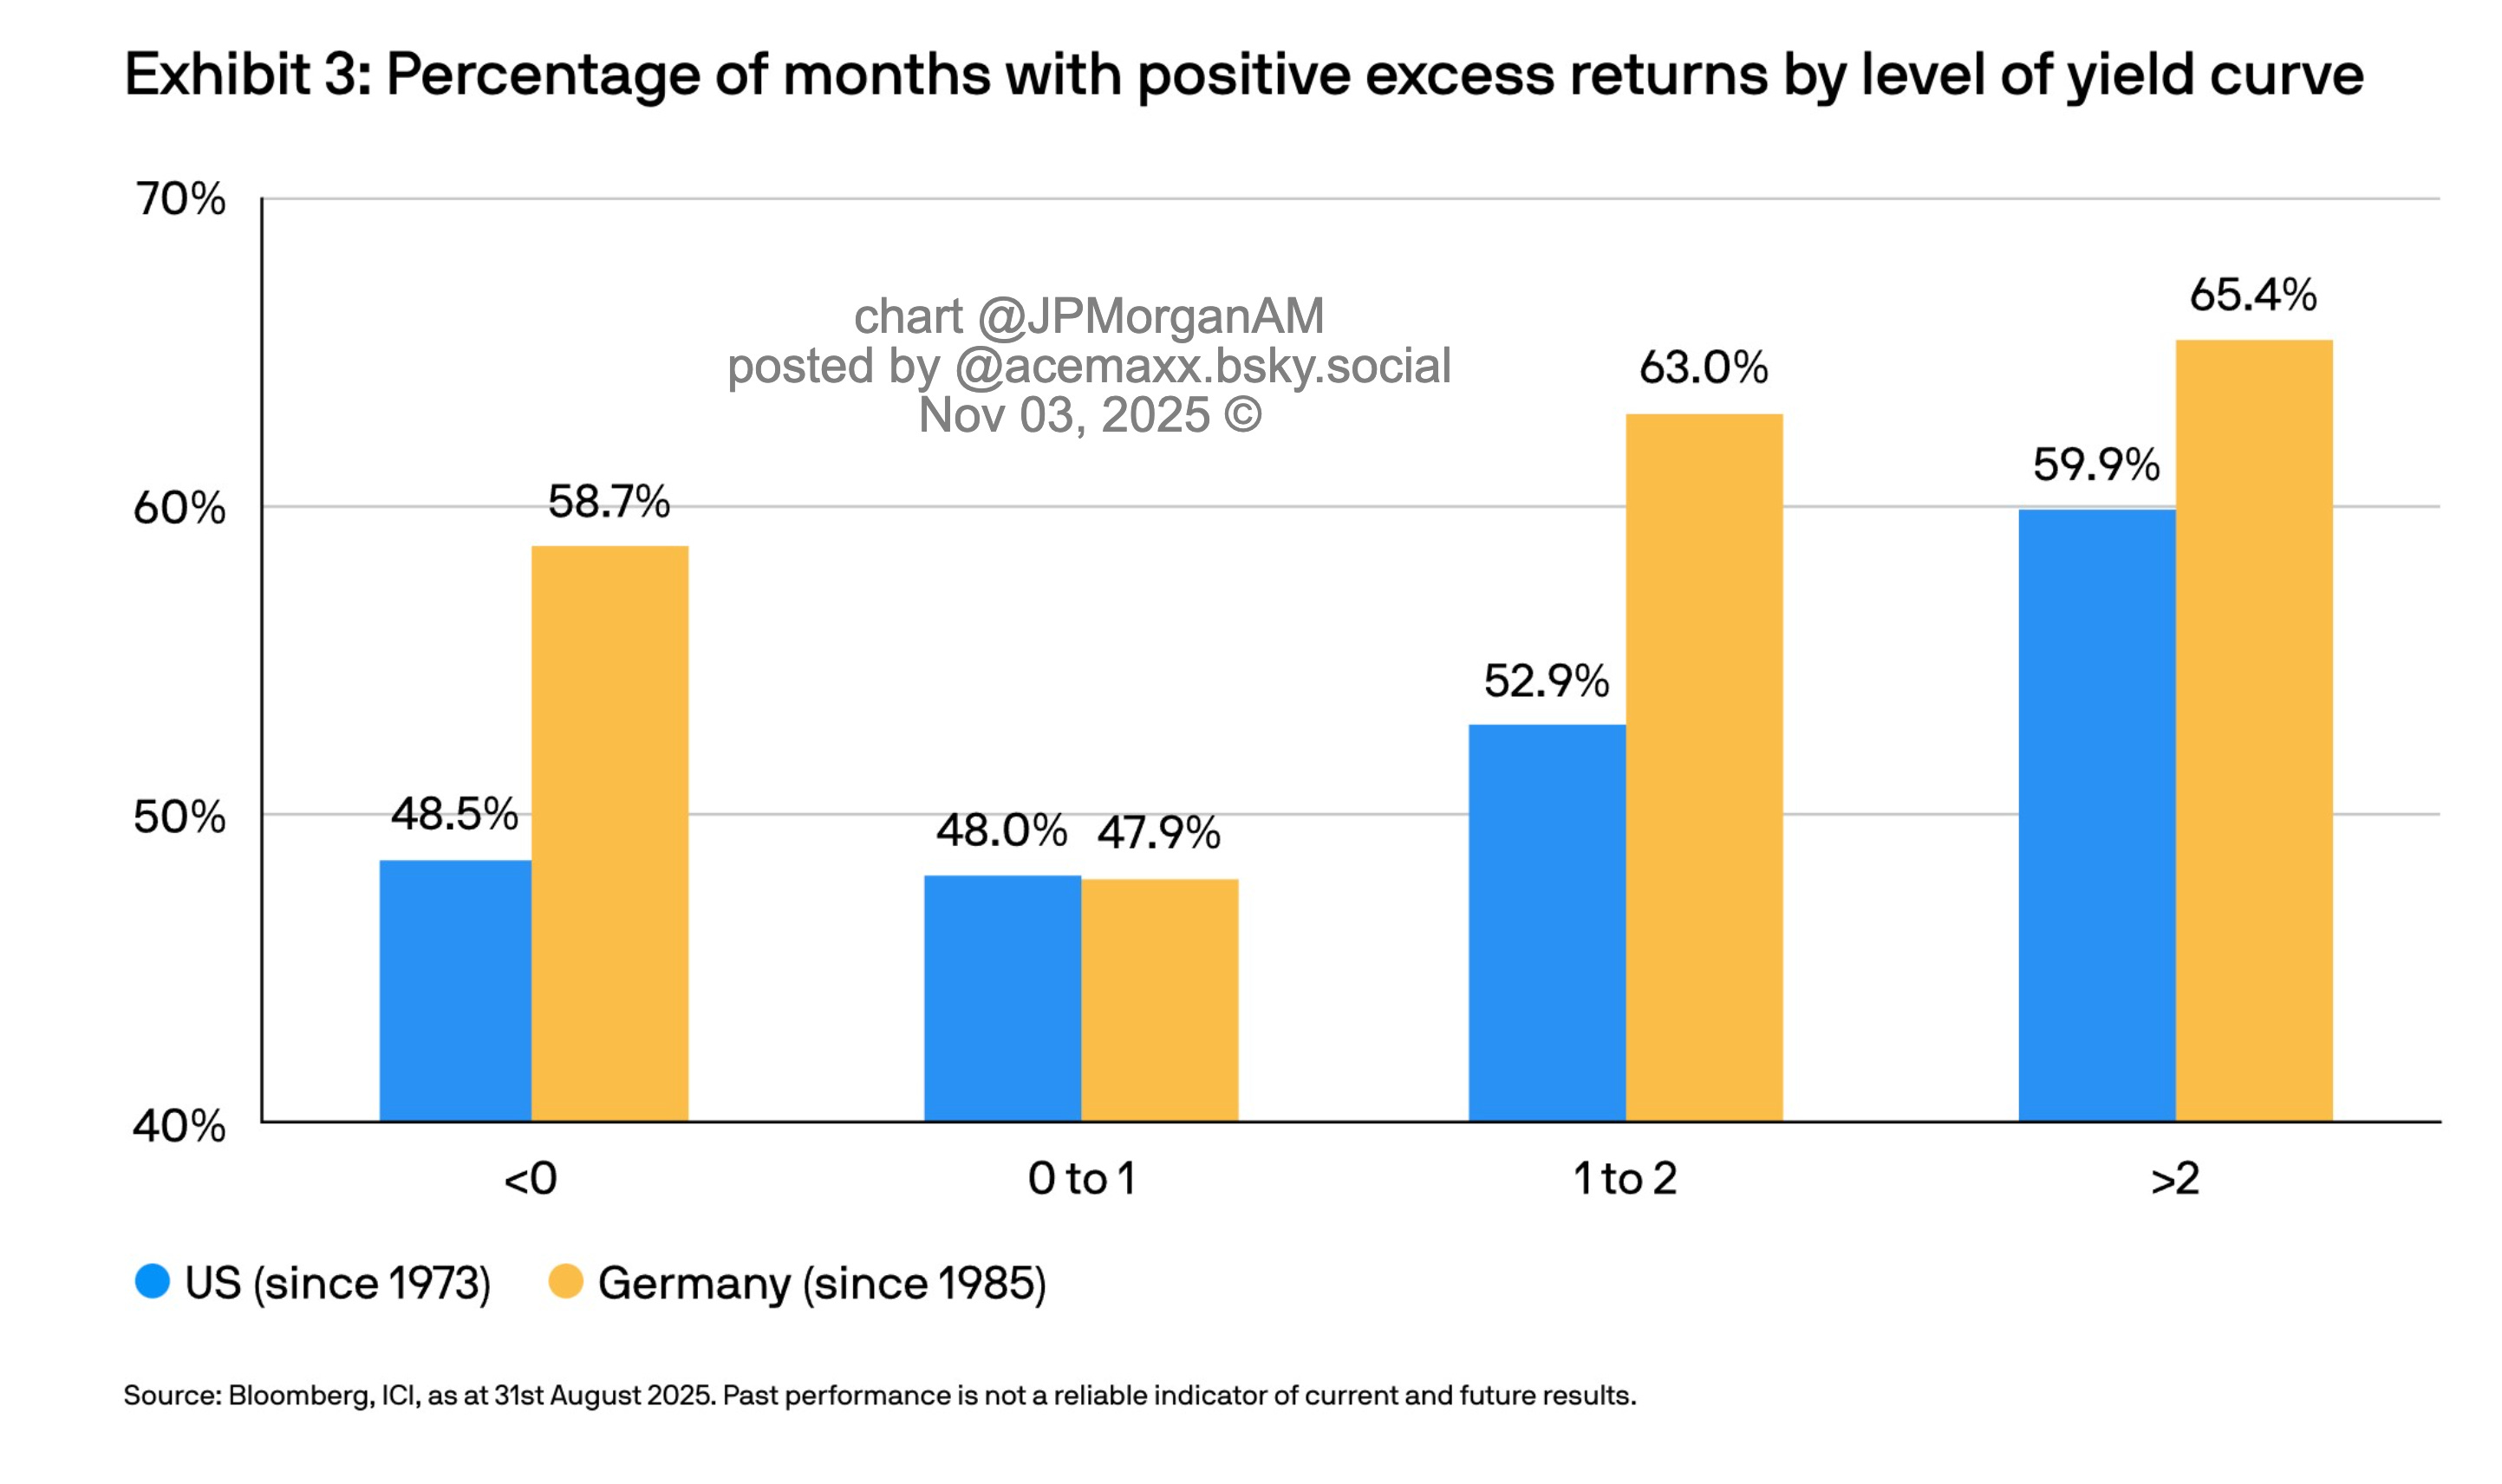
When the slope exceeds 1%, duration tends to beat cash; when that trade has run its course, the curve naturally flattens again.
The Takeaway
The current flattening of long-term Treasuries is not a mystery. It’s the logical consequence of disinflation progress, positioning shifts, and long-duration demand.
Far from signaling renewed stress, it’s a sign that the bond market is normalizing after a long battle with inflation — and perhaps hinting that the next policy phase will be one of patience rather than pain.