The Distortion for Credit Spreads
US corporate profits indicate that Monetary Policy is not that tight

What caught my eye this week was the following passage from a recent note from JPMorgan AM Research.
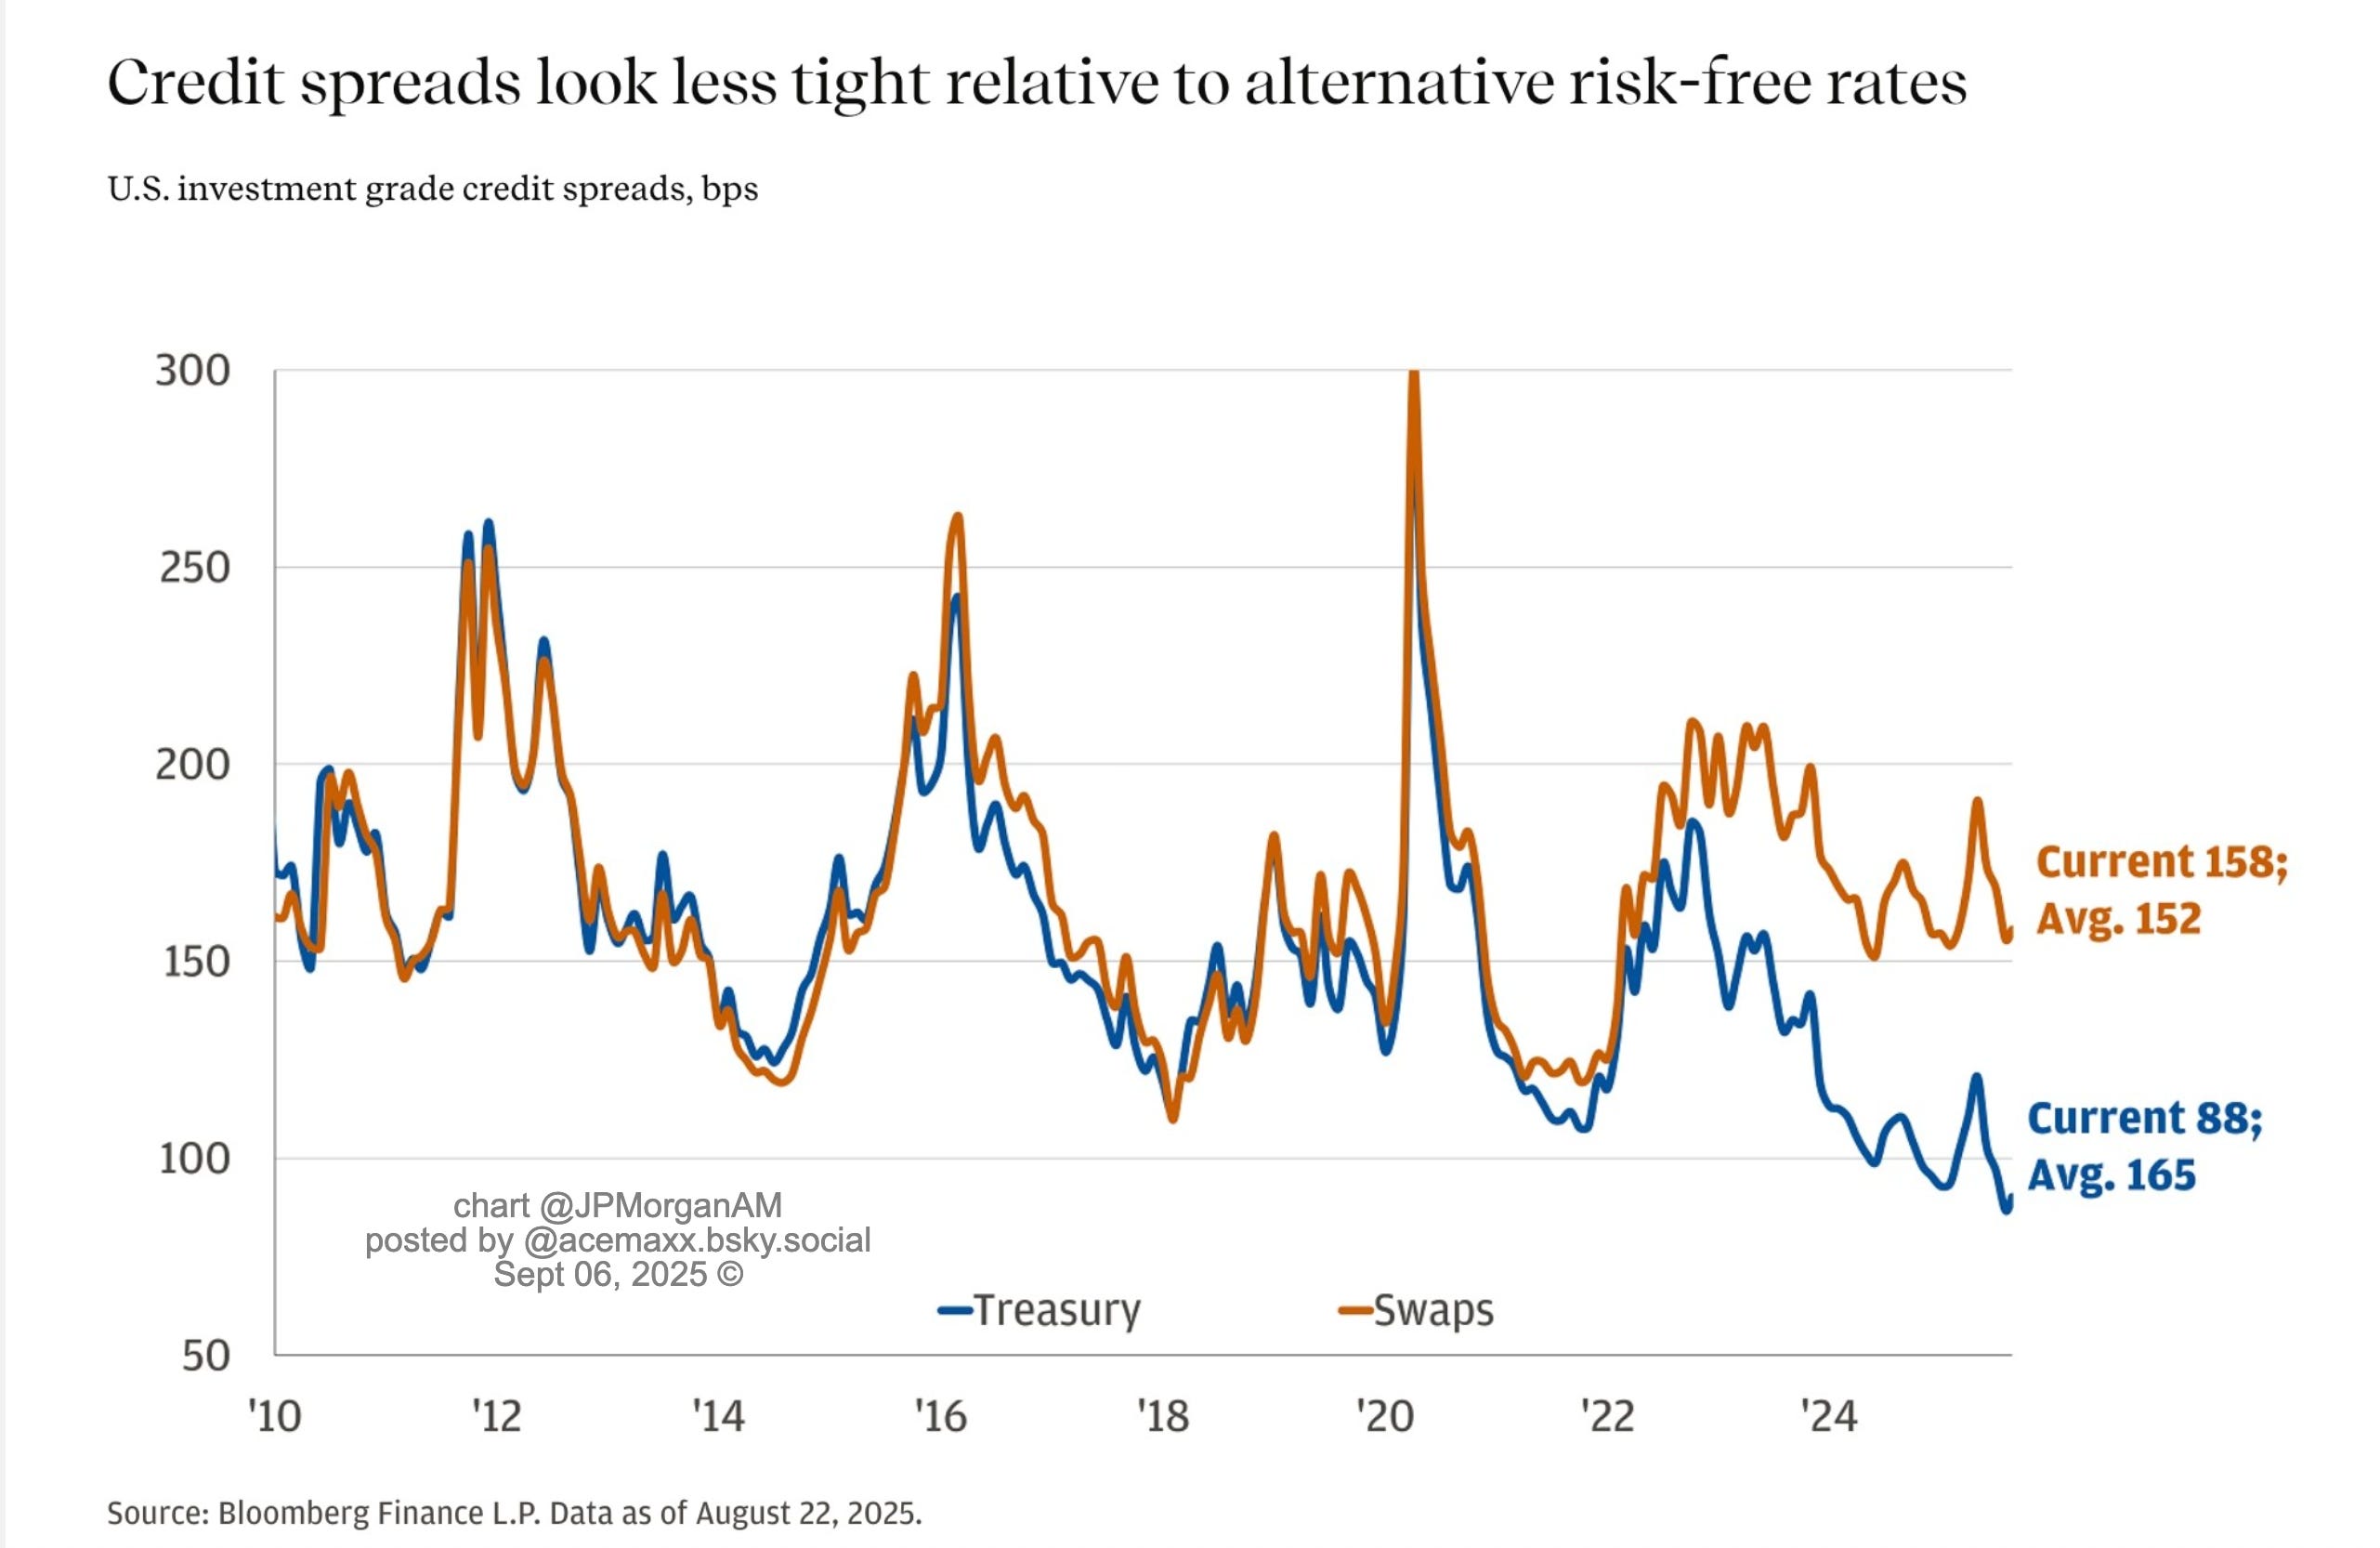
«Most people measure credit against Treasuries. Recently, Treasuries have traded more cheaply than other risk-free yardsticks—think heavy supply, larger deficits and a rebuilt “term premium.»
«Treasury yields are higher than they would otherwise be, so when you compare corporates to USTs, the “extra yield” looks smaller. If you use the swaps/derivatives curve built off SOFR—a cleaner proxy for the risk-free path—spreads look much closer to normal»
This is surely a subtle but very important point in fixed income right now. I will try to break the passage down step by step and then offer a “plain English” analogy.
The “benchmark” problem in credit markets
Credit spreads are usually measured as: corporate bond yield – Govt bond yield (same maturity).
For U.S. bonds, that means corporates vs U.S. Treasuries (USTs).
So if a corporate bond yields 6% and a UST of same maturity yields 4%, the spread is 2% (200 bps).
What’s happening with Treasuries
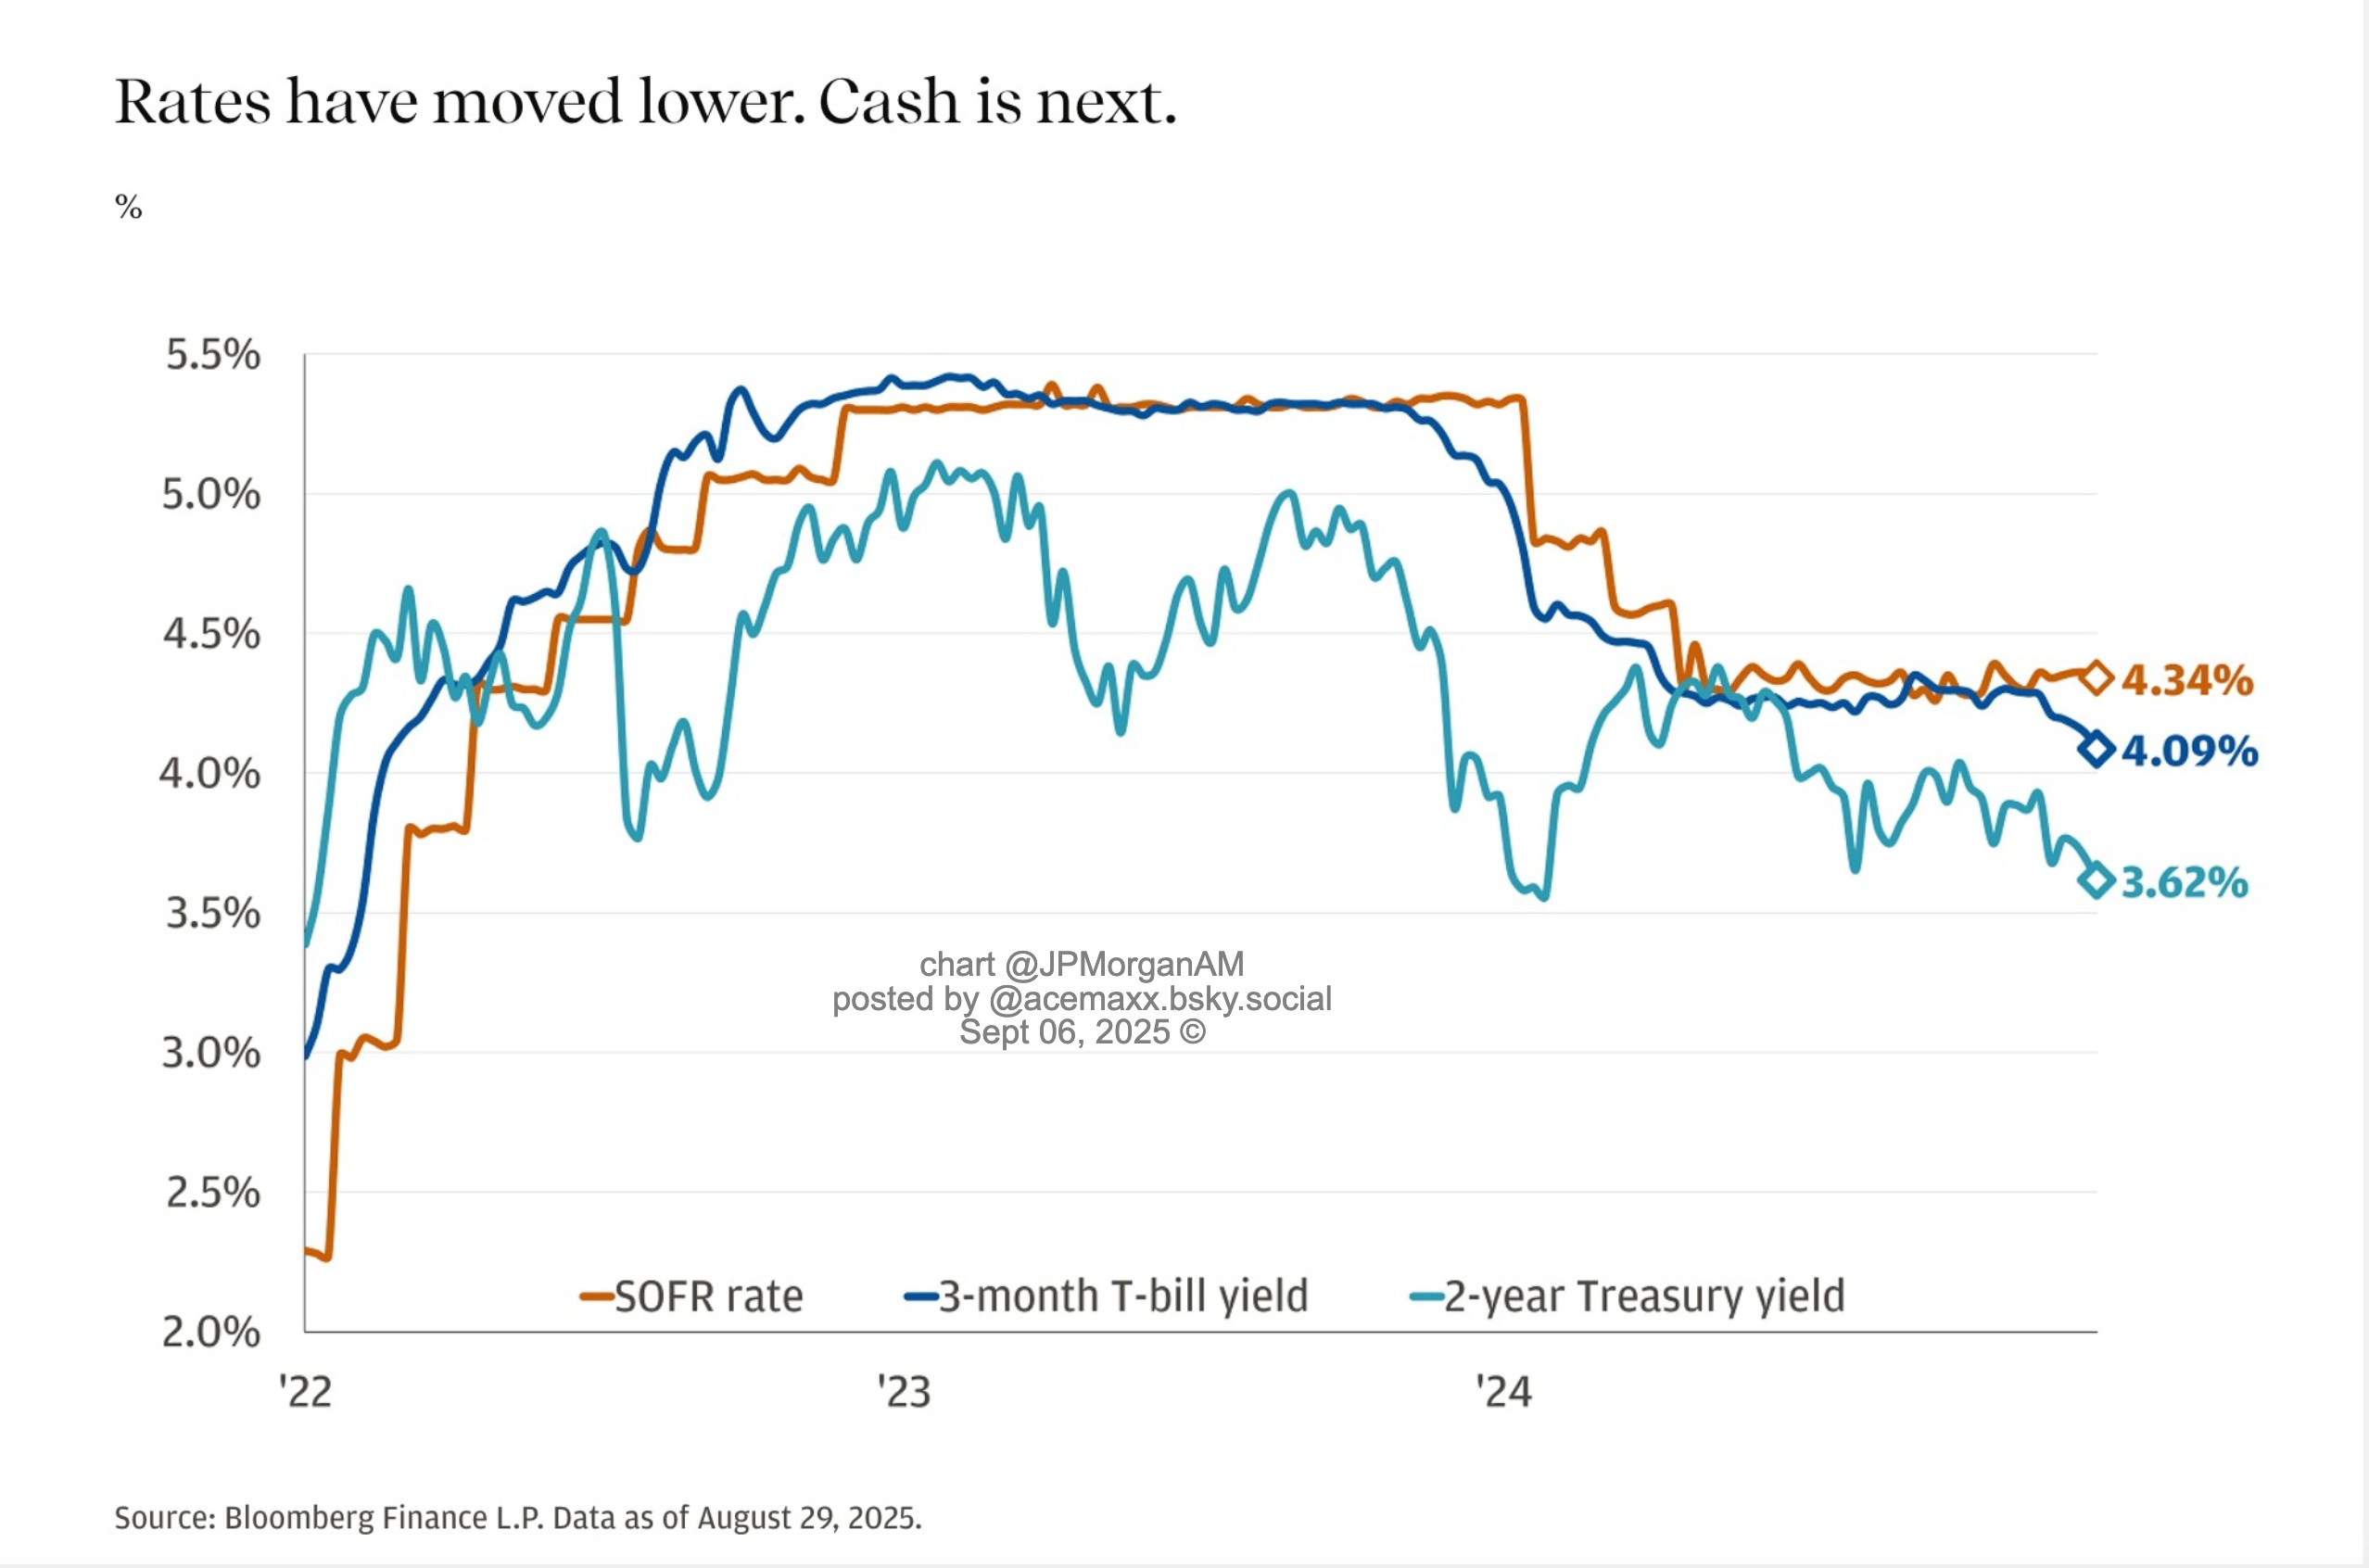
Right now, UST yields are unusually high versus other “risk-free” references (like SOFR-based swap curves).
Why?
Heavy issuance / supply → Treasury has to flood the market with bonds to finance deficits.
Larger U.S. deficits → fiscal sustainability questions raise risk premia.
Rebuilt “term premium” → investors demand extra yield to hold long Treasuries given uncertainty (inflation, politics, Fed balance sheet).
This means: Treasuries themselves are “cheap” (yields are higher than they’d be in a world without these distortions).
The distortion for credit spreads
Because spreads are defined relative to Treasuries, if UST yields go up for “idiosyncratic” reasons, spreads look artificially tight.
Example:
Corporate bond yield = 6%.
UST yield (distorted higher) = 4.8%.
Spread = 1.2% (120 bps).
Looks narrow/tight compared to history.
But if you instead compare the corporate yield to a cleaner risk-free curve (SOFR swaps), you might find:
SOFR swap yield = 4.3%.
Spread = 1.7% (170 bps).
Which is much closer to historical norms.
Plain English analogy
Think of it like measuring the price of apples (corporates) relative to oranges (Treasuries).
Normally, oranges are a stable reference.
Right now, oranges are unusually cheap (Treasuries yield more, price less).
So when you calculate “apples minus oranges,” the gap looks small — but that’s not because apples got expensive, it’s because oranges are cheap.
If you instead compare apples to bananas (SOFR swaps, which track the true “risk-free” path without supply distortions), the difference looks normal.
Bottom line:
JPMorgan AM is warning that looking at credit spreads vs Treasuries can be misleading right now. Treasuries are trading with extra yield due to supply/term premium, so spreads look tighter than they really are. If you use the swaps curve as the benchmark, credit markets don’t look abnormally tight — they look fairly valued.
In other words: The “global bond rout” has cheapened Treasuries relative to swaps, distorting the usual spread metric.