ECB’s Restrictive Monetary Conditions in the Face of Tariffs
ECB Policy Rate > Euro Zone Wage Growth

On Wednesday, the FOMC voted unanimously to keep the benchmark Fed Funds Rate in a range of 4.25% to 4.5%, where it’s has been since December.
Fed Chair Jerome Powell said he won’t lower borrowing costs until there’s more certainty on the direction of trade policy.
He called the Fed’s current monetary policy is only “moderately restrictive” and said that the central bank will continue to monitor economic data.
This “leaves us in a good place to wait and see,” Powell said of current borrowing levels amid uncertainty around tariffs.
“If the large increases in tariffs that have been announced are sustained, they are likely to generate a rise in inflation, a slowdown in economic growth, and an increase in unemployment”
It may be a moot point whether the US economy is facing a recession in the near future. What seems certain, however, is that weak growth is on its way.
Neil Dutta, head of economics at the Renaissance Macro recently highlighted that the Fed funds rate is higher than private wage growth, meaning the cost of borrowing is higher than the rate of wage gains.
"Historically, that is never a good place to be, as it's a sign that past policy has already been too tight"

Inspired by this background, I was interested in creating a similar visualization for the Eurozone, comparing wage growth with the ECB policy rate and including recession markers.
Upshot:
The current ECB policy is similarly restrictive with rates above wage growth.
The chart reveals several interesting patterns in the Eurozone context:
1.Recession patterns (grey shaded areas) show the Eurozone experienced more recession periods than the US, including:
2001-2002 (dot-com bust)
2008-2009 (global financial crisis)
2012-2013 (European sovereign debt crisis)
2020 (COVID-19 pandemic)
2.ECB rate > wage growth (pink shaded areas) occurred during:
Early 2000s (2000-2003)
Pre-financial crisis (2006-2007)
Present period (2023-2024)

3.Key differences from the US:
The ECB maintained a zero interest rate policy for much longer (2016-2021)
Eurozone wage growth was generally lower than US wage growth during this period.
The bottom line is that the current situation (2023-2024) shows the ECB policy rate exceeding wage growth, creating similar restrictive monetary conditions as in the US.
Historically, this relationship has often preceded economic adjustments or shifts in monetary policy.
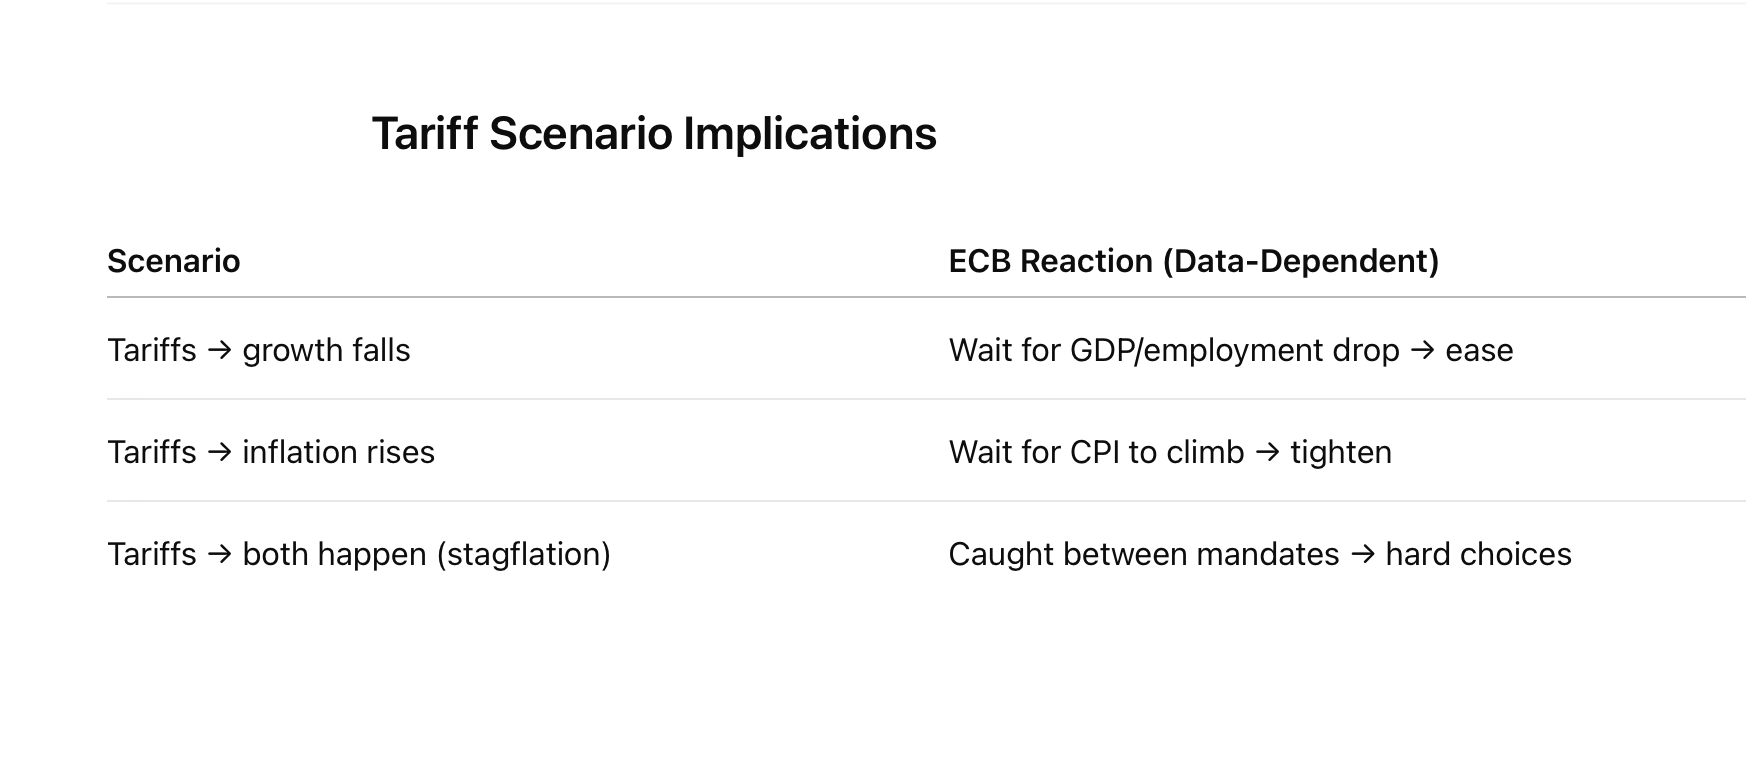
The data dependence means the ECB often responds after damage is done, especially with backward-looking indicators (like GDP or inflation).
Trade shocks (like tariffs) can produce conflicting signals (e.g., higher inflation + lower growth), making it hard to interpret data clearly.
The European policy makers conclusive can’t explain how they plan to respond to likely changes in economic conditions via tariffs. And being behind the curve might, for sure, cost employment in the euro zone.
«soft data» is the early warning system and hard data pulls the policy trigger: If soft and «hard data» diverge (e.g., businesses panic but real economy holds up), the ECB faces a communication dilemma.
It is essential to recall that waiting for hard data confirmation minimizes Type I errors (acting unnecessarily) but increases Type II errors (acting too late), a particularly relevant calculus when external shocks like tariffs are involved.
It would therefore not be unreasonable to expect that markets and businesses may struggle to anticipate ECB actions, which can cause financial instability in times of trade turmoil.
Furthermore, appearing too passive in the face of aggressive US trade moves may undermine confidence in Europe's policy response.
In a nutshell, the soft data vs. hard data distinction directly connects to the wage growth vs. policy rate relationship we observed in the charts above.
